
Network Monitoring Software Trusted by


Comprehensive network monitoring software
Scalable
Dynamic scalability for data processing. Monitor tens of thousands of data points via a distributed and tiered system.
Extensible
Event-driven architecture allows extension of service polling and data collection frameworks, and flexible workflow integration.
Supported
Supported by a large community of users and commercially by The OpenNMS Group.
Open source
Published under the AGPLv3 license, OpenNMS is a fully open source solution.


Latest blog posts
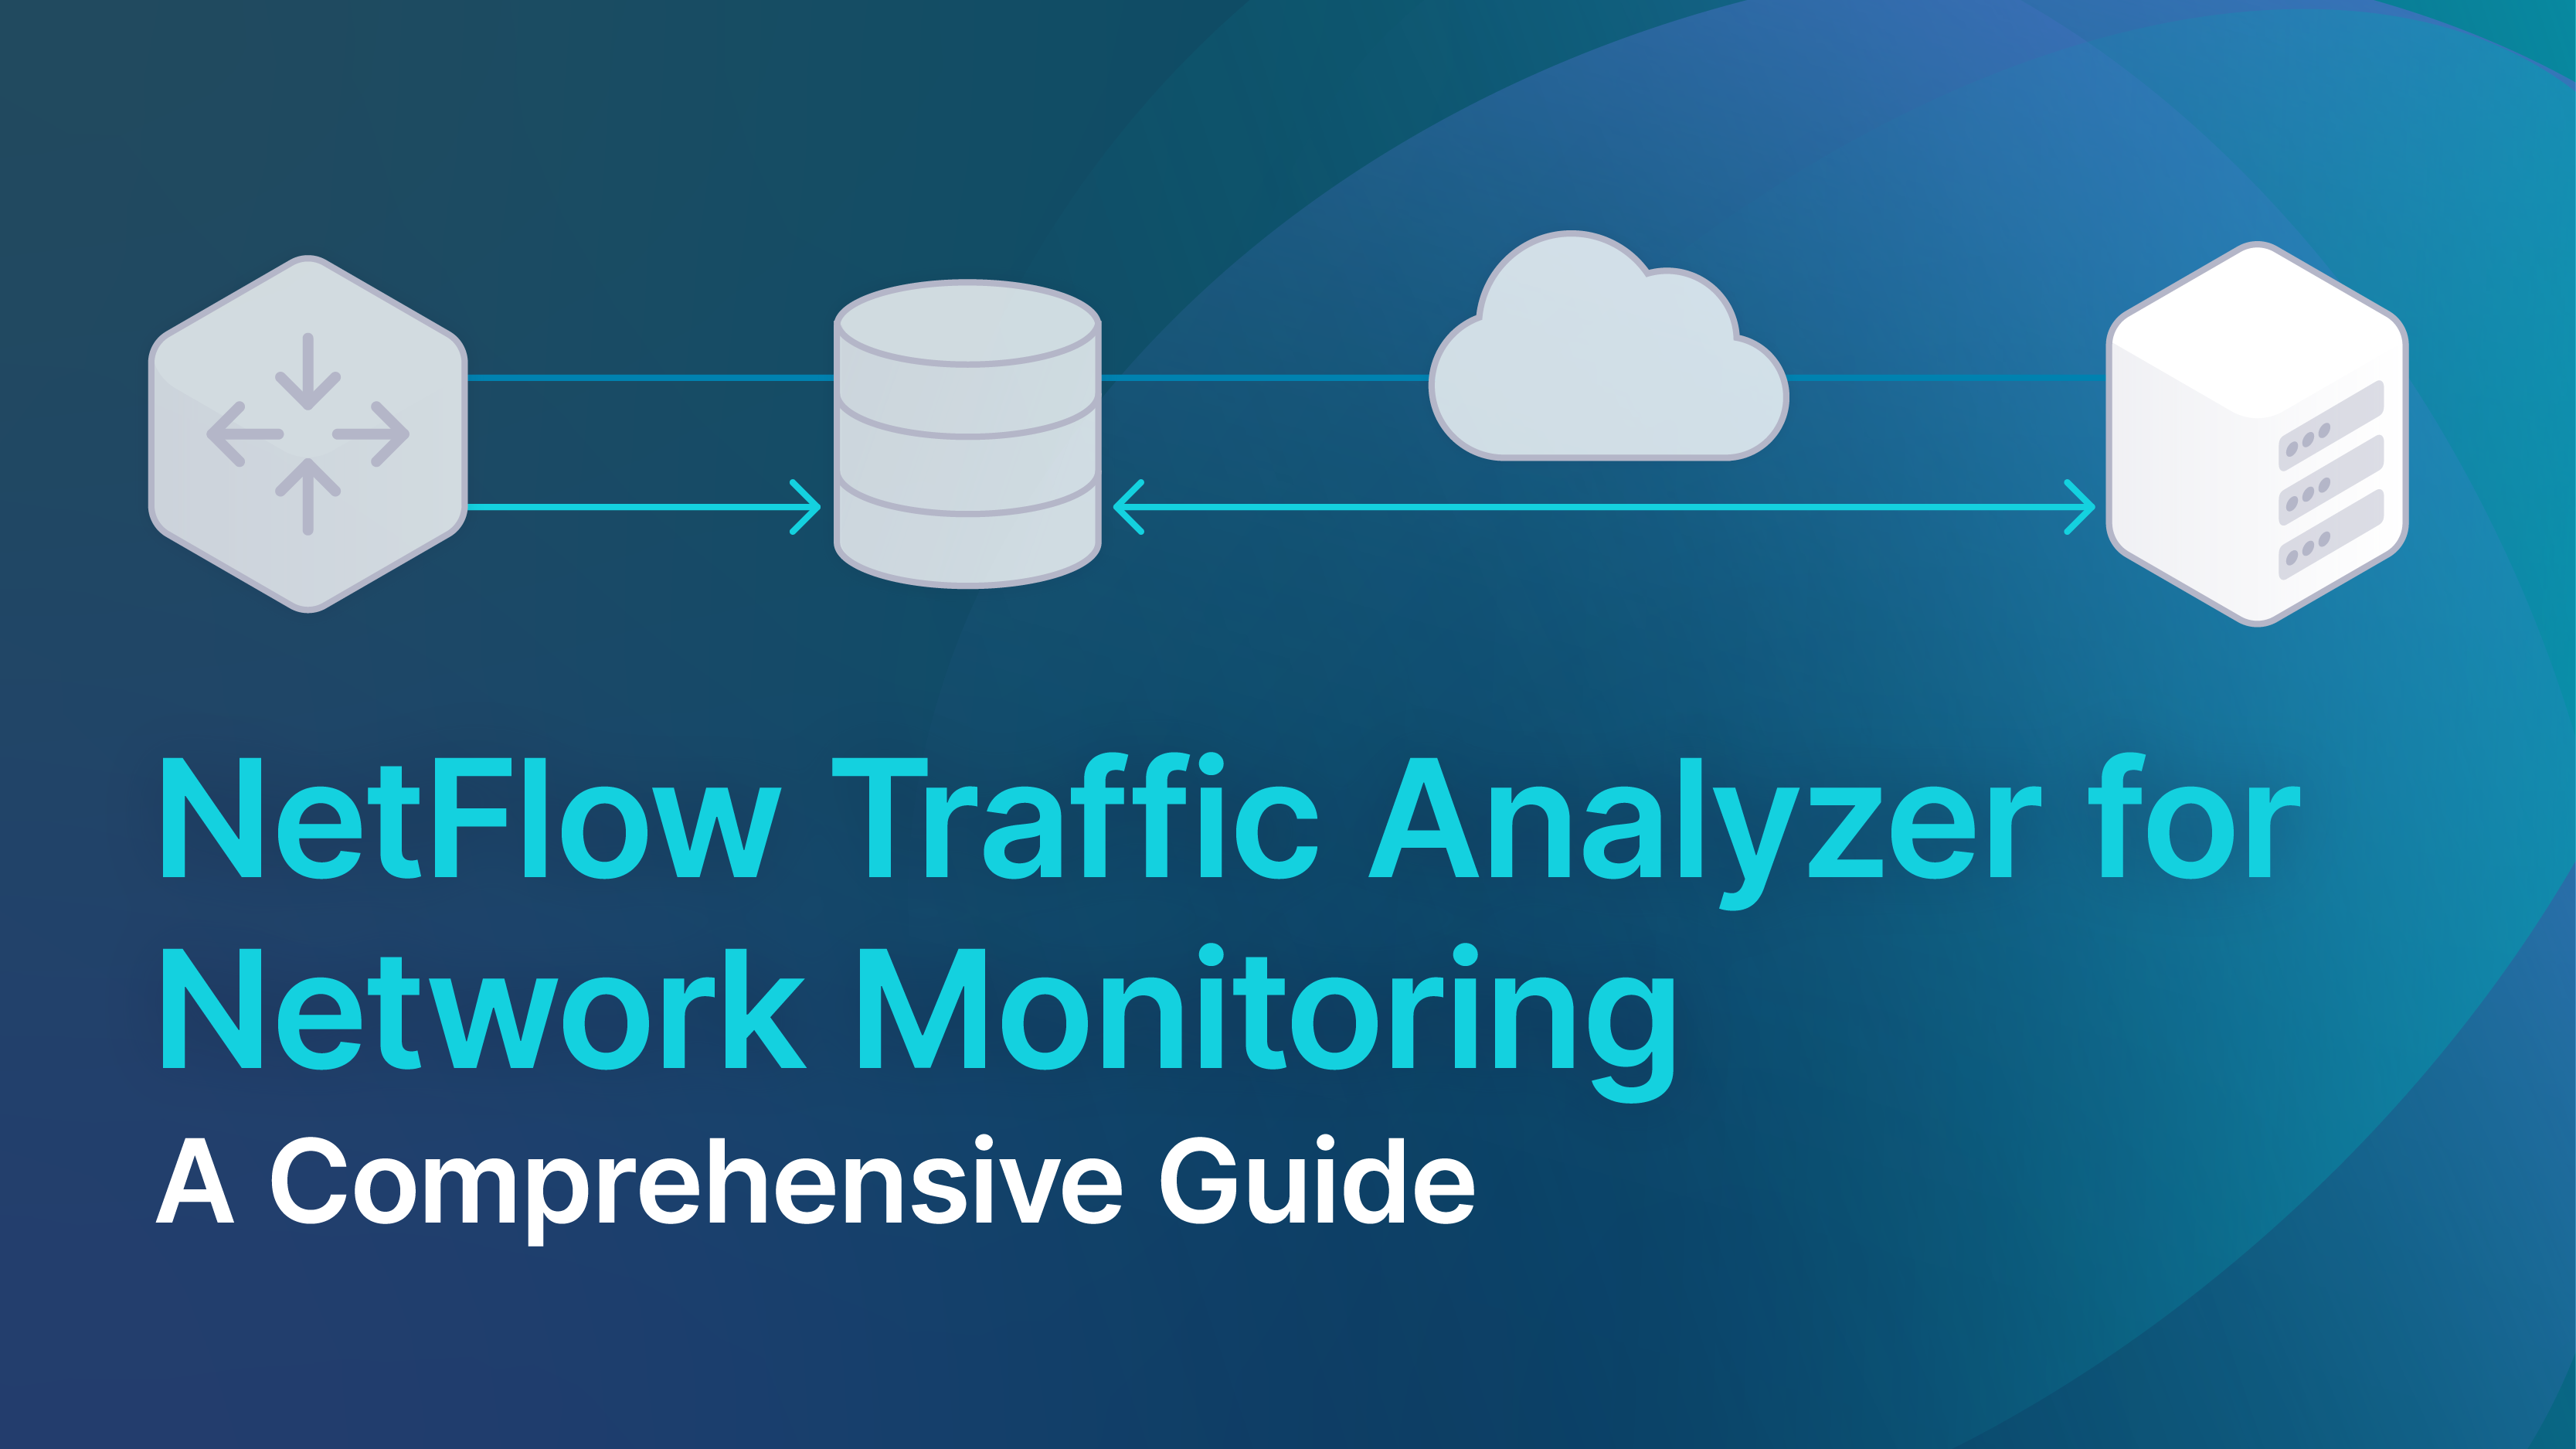
NetFlow Traffic Analyzer for Network Monitoring: A Comprehensive Guide
In the dynamic landscape of network management, NetFlow traffic analyzers stand out as indispensable tools for optimizing network performance [...]
SNMP Network Monitoring with OpenNMS Meridian
In this blog post, I’ll cover how OpenNMS Meridian can leverage SNMP network monitoring. SNMP [...]
Enterprise Network Monitoring with Flow Data
OpenNMS Meridian is a powerful enterprise network monitoring solution, thanks in part to its flexibility [...]